SVG only: Gauge data visualisation
Without knowledge of the SVG line animation, I couldn’t have created this without a library.
I was working on a project where I had to show sales category percentages in a graphical format. As the task occurred only once, I avoided using libraries. As everyone knows, I love SVGs. So I thought I’d try doing it with SVG.
The setup and creation of the demo.
This blog explains how I created this with the small demo. The setup uses SVG, React and CSS. To test with various percentages, I have added a control on the screen. This CodePen is a demo. Click on Result tab if you are not seeing the demo.
This demo sets the total sales at 100% and calculates the sales of the second category automatically when you enter the sales of first category. When we perform that action, the circular SVG will update based on the provided percentages for each category.
I used the SVG line animation technique to create this. There is no animation here, just FYI.
Creating SVG:
The process of creating this is below.
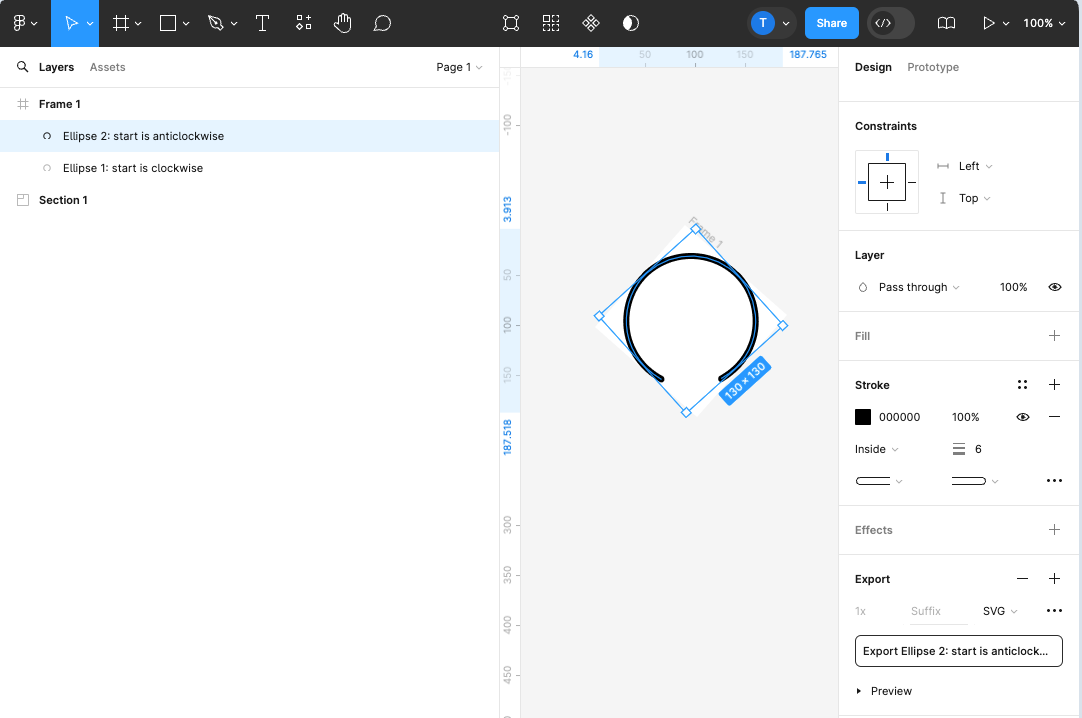
- Created 1 ellipse and then sliced it from the bottom to give the desired shape. Stroke used no fill with rounded corners. Below image shows a glimpse.
- Then copied the first ellipse and reverses it horizontally. It’s necessary for the second category to begin on the other side.

After exporting the SVG, we got two path elements inside it, one for each category. Below is the exported SVG.
<svg
      class="bar-svg"
      width="136"
      height="131"
      viewBox="0 0 136 131"
      fill="none"
    >
      <path
        d="M38.4211 127.419C-8.22873 100.072 -3.32312 45.5199 23.7294 21.1179C50.782 -3.28416 92.2678 -1.38642 116.391 25.3566C140.513 52.0996 140.533 102.694 98.3036 126.452"
        stroke="000"
        stroke-width="7"
        stroke-linecap="round"
      />
      <path
        id="cat-1"
        d="M98.188 126.092C144.535 98.2338 139.031 43.739 111.712 19.6352C84.3938 -4.46856 42.9313 -2.11577 19.1033 24.8903C-4.72462 51.8964 -4.18888 102.488 38.2985 125.781"
        stroke="000"
        stroke-width="7"
        stroke-linecap="round"
      />
 </svg>
Changes I did in this SVG after exporting it.
stoke: I gave the two categories different colors to make them visually appealing.pathLength="1": This lets us use total length of the line as 0 and 1, where 0 is the line’s start and 1 is its full length. So we don’t have to calculate manually the total length of the line.- All the attributes in camel case since we are using this SVG in React.
About technique
I’ll use the SVG line animation technique that uses two SVG attributes. stroke-dashoffset and stroke-dasharray. In order to move the line, we need a full length of the line. Hence, I have added a pathLength attribute.
First, we’ll determine the values manually. Consider category-1 as 40%, for instance.
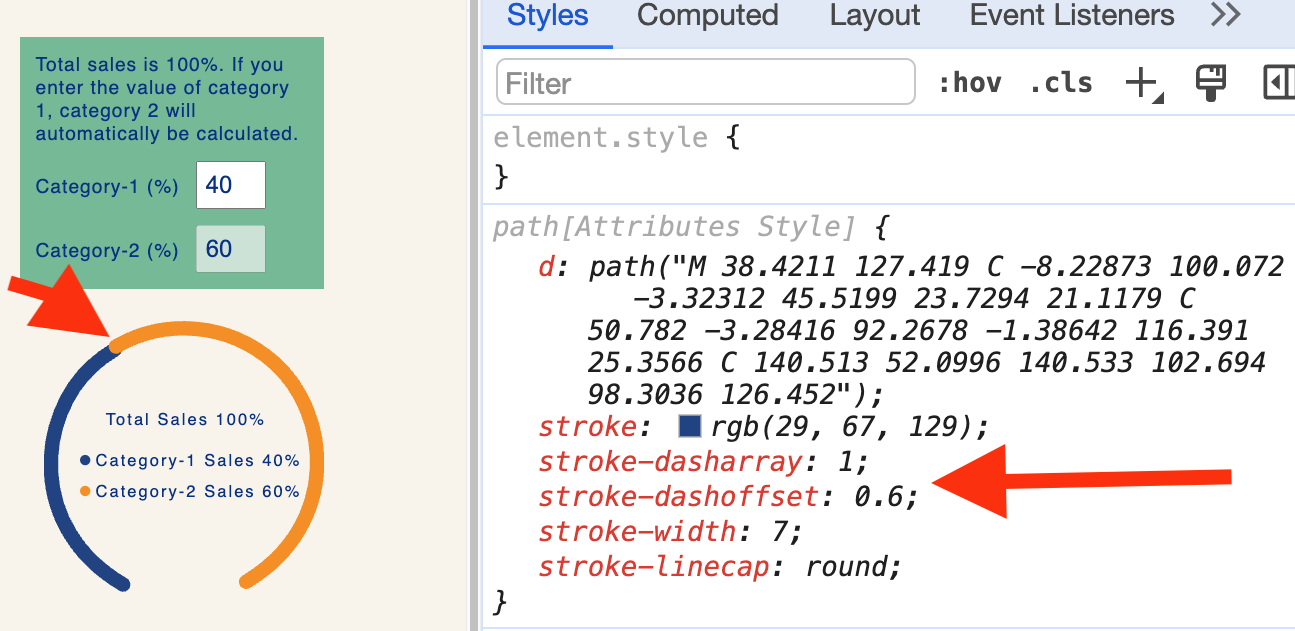
The stroke-dasharray="1" fixes the visible part of the line. Will figure out the value of the non visible part of the line using stoke-dashoffset.
Now category 1 is 40% means we need to show 40% as the visible part. So the stoke-dashoffset value will be the 60% to show 40% visible part.
Since we need all the line length values in 0 - 1 format. 60% will be 0.6. Let’s see in the image below.

The overlap shown in the image above occurs because of strokeLinecap="round".
To create a gap between the two, we will add a fixed value of 0.012. Add this value to the stoke-dashoffset.
Let’s automate these values in the SVG inside a react component.
const category1 = 50; //This is entered by the user in percentage.
const category2 = 100 - category1; // category 1 is coming from the user input default is 50%.
const gap = 0.012;
const totalLength = 1;
const strokeDashoffsetCategory1 = 1 - category1 / 100 + gap;
const strokeDashoffsetCategory2 = 1 - category2 / 100 + gap;
Give these values strokeDashoffsetCategory1 and strokeDashoffsetCategory2 in the SVG.
 <svg
      class="bar-svg"
      width="136"
      height="131"
      viewBox="0 0 136 131"
      fill="none"
    >
      <path
        d="M38.4211 127.419C-8.22873 100.072 -3.32312 45.5199 23.7294 21.1179C50.782 -3.28416 92.2678 -1.38642 116.391 25.3566C140.513 52.0996 140.533 102.694 98.3036 126.452"
        pathLength="1"
        id="cat-1"
        stroke={colors.highlight1}
        strokeDasharray="1"
        strokeDashoffset={strokeDashoffsetCategory1}
        strokeWidth="7"
        strokeLinecap="round"
      />
      <path
        id="cat-2"
        d="M98.188 126.092C144.535 98.2338 139.031 43.739 111.712 19.6352C84.3938 -4.46856 42.9313 -2.11577 19.1033 24.8903C-4.72462 51.8964 -4.18888 102.488 38.2985 125.781"
        pathLength="1"
        stroke={colors.highlight2}
        strokeDasharray="1"
        strokeDashoffset={strokeDashoffsetCategory2}
        strokeWidth="7"
        strokeLinecap="round"
      />
      ...Rest presentation elements
    </svg>
And TADA!